Interest in assessing the environmental impacts of digitalisation is growing. Environmental impact assessments have played an important role in the collective consciousness. While they are effective vehicles for raising awareness, these assessments may have focused attention on trivial, individual actions such as reducing email. These assessments can guide public and leadership understanding of the issue; however, here we highlight their limitations.
Environmental impacts assessment of ICT in organisations is in its infancy, and we need to accelerate its understanding. This requires the creation of commonalities to support transparency in both the process and the outcome.
As digital actors, we are familiar with the notion of the commons, whether through open-source or open-data. Why and how can we apply these concepts to the measurement of environmental impacts?
Open Data and Transparency as Decision-Making Tools
Environmental impact assessments should not be an end in themselves but instead assist the decision-making process within organisations, collectives and communities. Since assessments are colored by political choices, including choices of methodologies, scope, and primary and secondary data sources, it is a democratic necessity that the rights to audit, critique and improve these assessments be given to the public. It is a requirement for the quality and understanding of the decisions taken.
Today several studies, databases and tools have been created, sometimes with the support of states, with little or no transparency. These resources have guided and will certainly continue to guide the decisions of organisations and public policies. These approaches are even more problematic when we know the state of research on the subject. Indeed, the complexity, outsourcing and globalisation of digitalization make it difficult to assess the physical resources behind it. Thus, all figures reporting on the environmental impacts of ICT have a high degree of uncertainty and are subject to rapid change as the sector grows. Given these considerations, black box reporting, data, methodologies and solutions border on greenwashing.
Finally, transparency is a requirement for collective decision-making. Pending commonly accepted methodologies and the hypothetical opening of data by manufacturers and suppliers, the open approach is a key factor for improving the quality of assessment. Through an open and collaborative scientific process, open data and open source tools have emerged to strengthen individual initiatives and to put pressure on decision-makers and organisations for transparency against greenwashing.
The ecosystem of reference
Several organizations are key enablers of transparency. We could cite ADEME and Umweltbundesamt both French and German environmental agencies that have published several studies and are pushing for methodological normalization. Their capacity to share their work in English or even in multiple languages is an important challenge to overcome. Open source project such as Cloud Carbon Footprint, non-profits such as the SDIA and the Green Web Foundation are also important actors for transparency.
The Boavizta Project
Boavizta is a working group that aims to simplify, make reliable and accelerate the evaluation of the environmental impact of digital organizations. This voluntary initiative federates the actors of the ecosystem (companies, associations, research) and organizes the co-construction of expert and updated resources under free licenses: measurement methodology, data repository, calculation engine, etc.
At Boavizta we have been working with all these stakeholders to make the environmental impact assessment of ICT products, services and systems better, more understandable and more transparent. Since 2020, our work has been structured around three main stages:
Stage 1: Data Aggregation
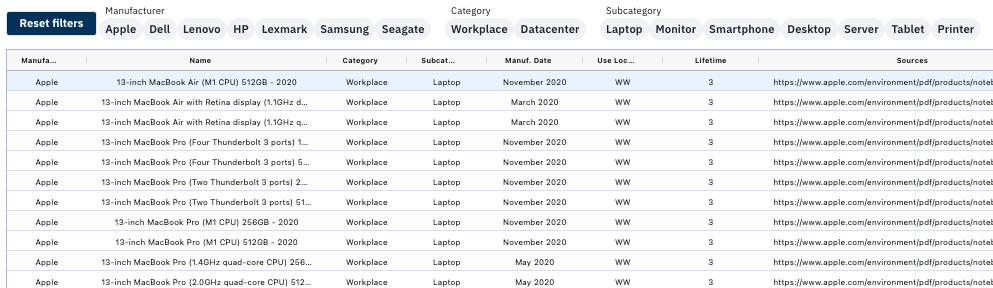
Data is often seen as the new oil. Interestingly, this is also the case in environmental studies. Whoever has the data is able to report (supposedly) more realistic emissions. This is why we at Boavizta have tried to give easy access to publicly available data. We have built a database of the impacts reported by manufacturers on their Product Carbon Footprint (PCF):
However, these data are based on hypotheses and methodology that are not publicly available. They mainly use PAIA, a statistical approach based on old LCA studies. Thus, the quality of the evaluation cannot be assessed, which is all the more problematic as they may strongly diverge from other impact databases such as ADEME or NegaOctet for certain types of appliances.
Secondly, with very few exceptions, these data focus on the carbon footprint and do not cover the use of other resources, which we were keen to be able to take into account.
These important limitations mean that the reliability of data from manufacturers or suppliers is far from satisfactory.
What is a Life Cycle Assessment (LCA)?

According to ADEME, “Life Cycle Assessment (LCA) is the most successful tool for global and multi-criteria evaluation of environmental impacts. This standardized method makes it possible to measure the quantifiable effects of products or services on the environment.”

Its main characteristics are:

* to treat the entire life cycle of products and services
* to be multi-criteria and therefore to allow a multi-impact assessment (rather than focusing only on climate change for example) and to avoid pollution transfers.
t* o be a standard (ISO-14040) that facilitates harmonization of environmental accounting. This allows, among other things, to evaluate the type of impact prevailing in the realization of a product or in a sector of activity.

In comparison, the Product Carbon Footprint (PCF) is only a single-criteria, undocumented and non-transparent synthesis of a possible upstream LCA.
Stage 2: Towards a bottom-up approach
In order to go further on our analysis and to increase its accuracy, we went in search of new studies and data allowing us to evaluate the environmental footprint of semiconductor manufacturing. This “component” approach appeared to be an interesting lead after consulting the study “Life-Cycle Assessment of Semiconductors” by Sarah B. Boyd.
In this book, the author states that the carbon emissions associated with the manufacture of high-density electronic components account for the majority of the emissions associated with server manufacturing.
Several studies—including the valuable one above by Sarah Boyd—highlight also several key points:
- the importance of the wafer manufacturing and chip assembly/packaging phases
- the same logic applies for the different types of electronic components: CMOS logic, flash memory and DRAM.
Semiconductors, these basic elements of integrated circuits also called electronic chips or electronic components, are the subject of this second iteration.
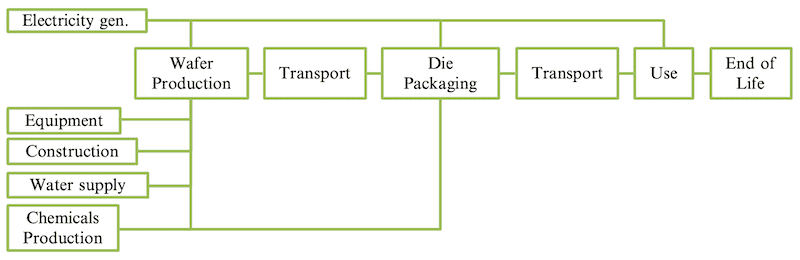
Below is a diagram describing the main stages of the life cycle of a component and the mobilized resources.
More about Wafer and Die:
- The term wafer is used to describe a very thin slice or substrate of a semiconductor material such as crystalline silicon (c-Si). The wafer is then subjected to various techniques such as doping, etching, thin-film deposition of other materials and photolithography to fabricate a chain of microstructures or microcircuits
- The wafer is finally cut to obtain a set of 'die'. The term die refers to the square of silicon containing the microstructures forming an integrated circuit. By extension, the die is synonymous with an electronic chip.

As described in the Techspot article "What is Chip Binning?", manufacturing a wafer is a complex process that generates a significant environmental impact. These wafers are available in a variety of diameters ranging from 25.4 mm (1 inch) to 300 mm (11.8 inches).

To learn more about the wafer manufacturing process and its environmental impacts, we also recommend consulting the CNRS Ecoinfo website (French).
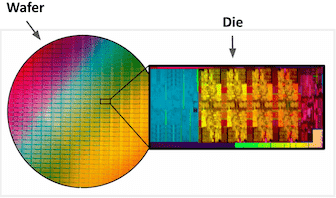
The die area (i.e. the surface of the electronic chip) therefore appears to be an essential piece of information to evaluate the environmental impact of CPU, RAM and SSD components.
We had to find a way to estimate this surface from the technical characteristics of the components.
With the importance of multi-criteria impact analyses in mind, we pursued our research and our attention was drawn to the study “Green Cloud Computing” published in 2021 by the German Federal Environment Agency (Umweltbundesamt). This document is very interesting for several reasons:
- It proposes a bottom-up approach that allows us to understand of the impacts from the unit components (including the server components).
- It is a multi-criteria LCA with notably the GWP (Global Warming Potential), PE (Primary Energy) and ADP (Abiotic Depletion Potential) indicators.
- The study is very well documented with a great concern for transparency.
Based on these last elements, we can propose a multi-criteria assessment of the environmental impacts of an IT asset (mainly server for now) based on its technical characteristics. All the results and methodology details are documented in this article.
This second phase allowed us to make progress on several aspects:
- A better understanding of the key elements (CPU architecture, storage density) for a more accurate assessment of the environmental impacts of server manufacturing
- Impact factors by component
- A multi-criteria evaluation and confirmation of its importance, particularly for the ADP indicator
Why should the ADP indicator be considered?
Abiotic Depletion Potential (ADP) assesses the use of fossil minerals and raw materials. The term “abiotic resources” refers to non-living resources such as soil, water, air and minerals.

This indicator is expressed in kg antimony equivalents (kgSbeq). Antimony (symbol Sb) is the chemical element used as a reference unit to quantify raw material consumption in a life cycle assessment.

Some studies differentiate between impacts related to mineral resources (ADPe or ADPelement) and those related to fossil resources (ADPf or ADPfossils)

ADP is a key indicator for an LCA of a digital product or service because this industry is particularly mineral intensive. For example, there are more than 60 elements of Mendelleev's table in a smartphone!

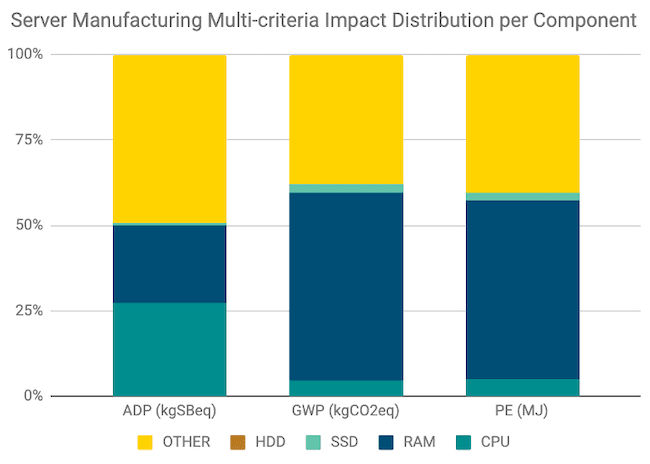
Why a multi-criteria approach?

When we represent the relative importance of the components for each indicator (based on Boavizta assessment), we can see significant variations in the image below.

If we focus on GHG emissions, the importance of RAM is considerable compared to CPU. Especially in the case where the amount of RAM is very large. If we look instead at the Abiotic Resource Depletion (ADP) indicator, the relative impact of the CPU increases significantly when that of RAM decreases

This example shows that the indicators are not perfectly correlated and that a multi-criteria evaluation is essential to avoid impact transfers.
Stage 3: Facilitate Use and Accelerate Deployment Through Tools
The Boavizta initiative was founded on the desire to simplify, improve accuracy and speed up the process of evaluating the environmental impact of digital organizations.
Methodologies and data are heterogeneous, of varying quality and age, and cover diverse perimeters. They evolve rapidly at the pace of knowledge. Their integration and industrialization in tools and processes of organizations are therefore potentially costly without guaranteeing accuracy.
For these reasons, Boavizta has decided to propose an API (Rest) allowing to integrate and industrializing the process of measuring the environmental impacts of equipment, systems & digital services. We provide an interface to the data and methods allowing this evaluation, which the group will update and refine over time.
In our engagement against black box solutions we have been creating an ecosystem of open-source tools helping anyone to conduct an impacts evaluation of ICT equipment and services freely from community-based methodology:
- Boaviztapi: Assess a multi-criteria environmental impact of your servers, components and cloud instances with our API. Depending on the completeness of the input data (usage and technical characteristics) the calculation engine completes it with the closest component data found in the database or by a default value.
- Boagent : Get usage and technical characteristics of your server, VM or applications with our API. The framework has been developed in cooperation with the SDIA.Boagent is complementary to Boaviztapi. It provides the data needed to use the calculation engine.
- Cloud-scanner : Getting usage and technical characteristics of your cloud instances to evaluate their impacts (AWS for now) with our API.
- More to come!
We have also interfaced with other open-source tools that have been developed by members of Boavizta or people from our ecosystem. We could cite Scaphandre or Power Joular both energy consumption metrology agents for computing devices.
Our API is described in more detail in this article.
Conclusion
Today our research of data, evaluation methods and successive iterations presented in this article lead us to highlight two observations:
- The digital domain is deeply immature in terms of environmental impact assessment. Very few data exist and those provided by manufacturers are often not transparent, poorly documented and based on a single criterion.
- However, the lines are moving and new research publications – notably by the German Federal Environment Agency – are finally making it possible to obtain the first reliable multi-criteria impact factors.
In addition to these findings, we have also drawn various lessons from this work. The first practical results are very positive—it is possible to perform a multi-criteria assessment of server manufacturing, based on a bottom-up approach, i.e. from the key components.
Also, the importance of a multi-criteria approach is validated: whether it is to avoid pollution transfers or to integrate the most specific indicator in the digital domain (ADP), we demonstrate that the use of a multi-criteria evaluation seems more than ever indispensable. The community can use tools & APIs to exploit these data and evaluation methods.
We are at the beginning of a long and ambitious project and we need to continue to i) the study of the state of the art, ii) validate and reference the most relevant data in an open database, and iii) target international collaboration.
Do you have any insight on those topics or want to help? Let us know here.
About the Authors
David Ekchajzer is working on a thesis in favor of a more systemic consideration of the environmental impacts induced by digitization at Hubblo. He contributes to Boavizta’s product and methodologies through his research work.
After working for more than 25 years in the digital service industry as an entrepreneur or product manager, Eric Fourboul is now working on the assessment of their environmental impacts in order to reduce them. Co-founder of Boavizta and Hubblo he is particularly interested in the use of Life Cycle Assessment methodology.