Can you estimate the order of magnitude of your carbon footprint? How about our remaining carbon budget? Given our current footprint, in how many years will that budget be used up? I‘m a physics student and my fellow physicists often cannot answer such Fermi-style problems. So let‘s take a look together at existing data on carbon emissions. Getting this quantitative grip on the situation is key to solving the often abstractly phrased problem of climate change. Equipped with this improved sense of scale, we can find effective solutions within our local communities as well as put accelerating pressure on governments, global companies and other large-scale actors.
It‘s summer. Summer school time. We‘re in Florence, sitting in front of anti-pasti, stone oven baked pizza and the local specialty, truffle pasta. After a day of lectures, it‘s time to socialize over dinner and get to know the other graduate students attending this summer school on quantum simulation of field theories.
“I was just at Strings in Vienna,“ says J., a young PhD student from the US. He starts recounting the highlights of his trip to the annual gathering of the global string theory research community. It definitely seems like he had a good time, including some beers with many new physics friends and potential future collaborators.
“Cool! A professor I still know from my physics undergrad at ETH in Zurich was there, too,“ I chime in. “Did you run into him? Prof. Nikas Beisert?“
“Hmm… I don‘t think so. Did he give a talk?“
“No, but he had a poster at the poster session. A rather unusual one. It was entitled “CO2 Emissions from Theoretical Physics Research?“. He was inviting people to share their thoughts by sticking post-its under some questions he had prepared.“
“Oh, right…I remember now…Well, in any case, I didn’t feel like I had much to add.“ J. shrugs his shoulders.
My heart sinks. Thoughts race. Not much to add? Are you serious?! How can you not have an opinion on the consequences of the researcher lifestyle you‘re getting yourself into?!
The conversation continues in a similar vein with more discouraging comments from around the table. “I just want to do physics. So of course, I‘ll have to fly to conferences. You’ve got to travel to become a successful researcher. Otherwise, no one will know about your results. That‘s just how academia works. What am I supposed to do?“
I stare at the olive oil. How can it be that we are all young physics students, in the same boat of becoming researchers and yet we feel so differently about the wider implications of choosing this path? As physicists, we are trained to work with orders of magnitude and yet you choose to be indifferent about following an outdated, clearly untenable lifestyle?
On the walk back home, the night breeze cools off my hot thoughts. Hmm, maybe you aren’t actually aware of the orders of magnitude. Probably you haven‘t played around with the graphs, charts and tables on the webpage of Our World in Data. Maybe you have no clue what I mean when I‘m referring to our unsustainable mode of operation…Well, time to walk through some numbers and get us on the same page.
Our Remaining Carbon Budget
First, let’s follow a little calculation by Prof. Stefan Müller, a linguistics professor at Humboldt University in Berlin. Our starting point is a table from the latest IPCC report:
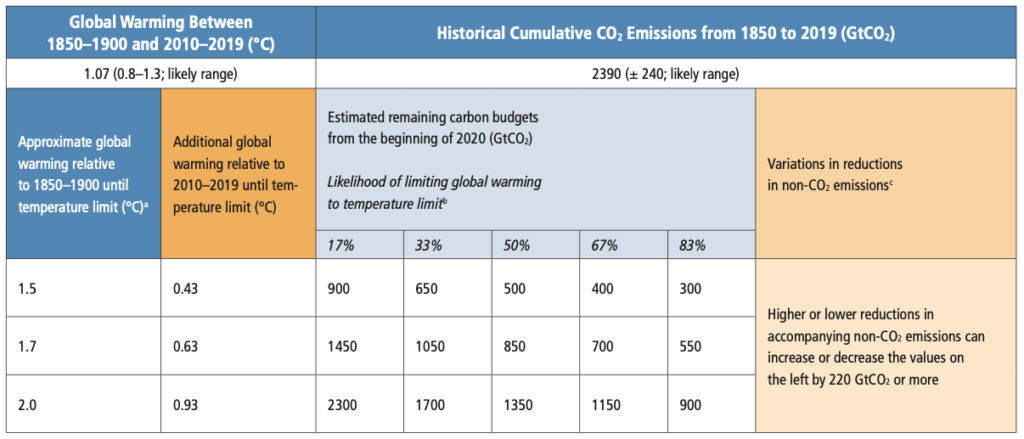
This table gives us concrete numbers for our remaining global carbon budget: After emitting how many tons of CO2,2 from 2020 onwards, will we face a temperature rise3 of 1.5°C, 1.7°C or 2.0°C, relative to preindustrial times?4 Importantly, the estimates come with a probability of reaching the temperature target we choose to aim for. I will use the number with the highest probability (83%) of achieving the 1.5° goal, i.e. 300Gt CO2. (So, let‘s make a mental note that the budgets we will calculate below won‘t guarantee success, they are rather our best shot.)
To obtain our current remaining global budget, we need to subtract the emissions from 2020 and 2021 which amount to roughly 31.5Gt and 33.0Gt, respectively, according to the International Energy Agency. Thus we are left with 300Gt – 31.5 Gt – 33.0 Gt = 235.5 Gt. How do we break this number down? I think it is fair to allocate the same budget to every human, especially since we are interested in orders of magnitude here. This gives us an estimate of
235.5Gt / 7.9 billion people ~ 29.8 t / person.
If you emit more than roughly 30 tonnes during your remaining lifespan,…, someone else needs to emit less such that we stay below the aim of 1.5° global warming with an 83% likelihood.
A Physicist‘s Carbon Footprint
So far so good. Now let‘s move on to our physics community: Given the current boundary conditions of life in academia, how much carbon does a physicist typically emit? Let‘s take the Max Planck Institute for Astronomy as an example. The MPIA published a quantitative analysis of its GHG emissions in 2020 which includes the following table:
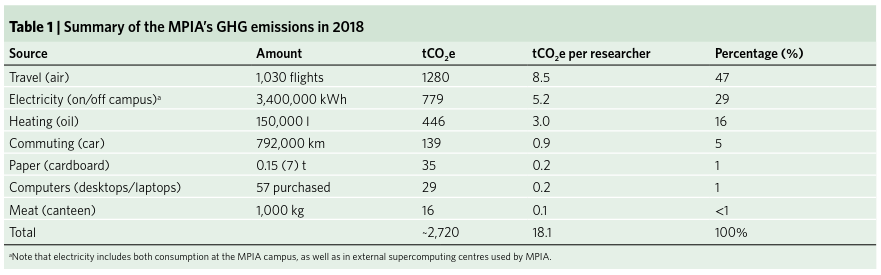
The authors found that pre-pandemic, an average MPIA researcher emitted roughly 18 tonnes CO2 eq5 in one year. Would that have been your estimate? If you‘re a physics teacher, go ahead and include this question in your next list of Fermi problems.
Brief interlude: Of course, behavioral patterns and infrastructure at your institute or university might be different. Emphasis on might. Because unfortunately, it is not yet the norm for our home organizations to have a good quantitative grip on our emissions, even though this is the basic stepping stone on which an informed decision and strategy must be based. Hence, I encourage you to take the Max Planck report authors up on their invitation:“This report can therefore serve as a template for other institutes“. No need to reinvent the wheel. Let‘s just get our numbers out on the table.
Since we‘re here already, let me add a little more flavor to the table above. From my experience, the number 8.5 t/researcher due to flying is a little high. At my undergrad university (ETH Zurich), we conducted a similar analysis in the physics department (DPHYS) in 2020. For emissions resulting from air travel (averaged over the period 2016-2018), we obtained 3.22t / DPHYS researcher which is under half the MPIA number. One could hence conclude that the MPIA emissions lie above those of a typical physicist.
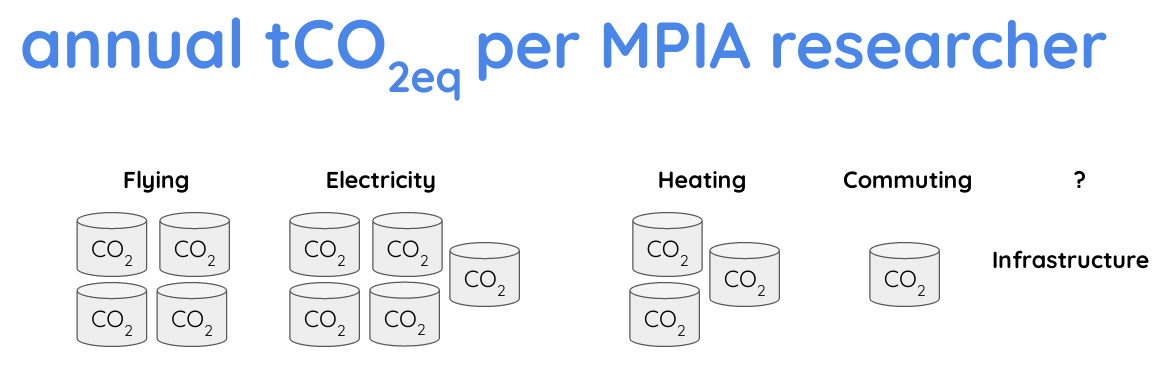
To get a better feeling for these numbers, I dug around a bit and found the slides from a presentation given by Jan Rybizki, one of the MPIA report authors. At the beginning of his talk, he mentions that MPIA has slightly updated7 their numbers for the year 2019 and gives the following overview, where one grey cylinder stands for 1t CO2eq (Figure 4). We can read off an updated contribution of roughly 4t per researcher due to flying which is indeed closer to the DPHYS value of 3.22t.
Getting curious myself, I also wanted to get a better feel for the electricity contribution, valued at about 5t per researcher both in the report as well as in the presentation. Is that a lot? Let‘s calculate. In 2019, Germany consumed roughly 604 TWh of electricity (source: Our World in Data). With a population of 83 million, this means ~ 7.2 MWh per person. Of this, roughly 4.4. MWh is consumed at work, the rest in private (source: Jan‘s talk11, slide 32). How do we convert these values to CO2 emissions? This depends on the energy mix of the country in which the electricity is being used. Let‘s have a look at a carbon intensity map:
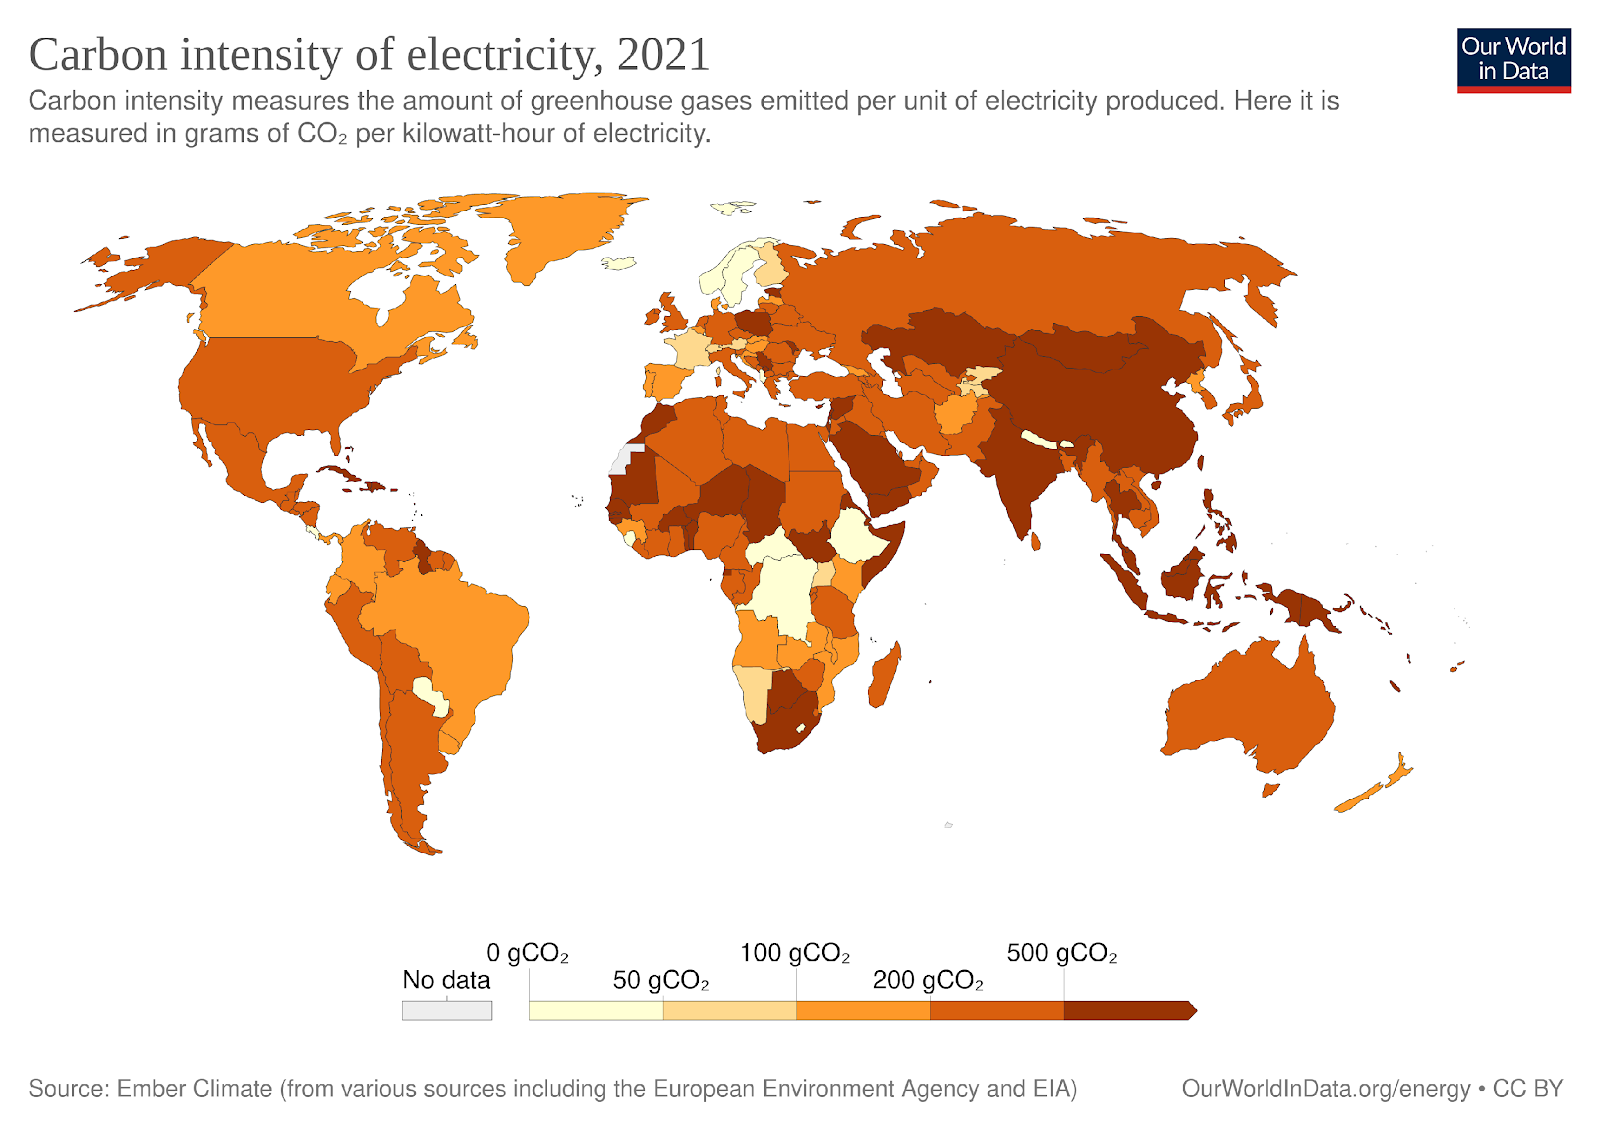
It turns out that Germany has a rather high carbon intensity factor of ~0.35 kg CO2eq/ kWh with over 75% of its electricity being produced from fossil fuels (source: Our World in Data). Thus we see that the average German produced 4.4MWh * 0.35 t/MWh ~ 1.5t of CO2eq by consuming electricity at work in 2019. That‘s over three times less than the MPIA value of 5t.8
One more comment: What exactly makes an MPIA physicist‘s academic life so electricity-intensive? The answer: super-computing. Concretely, the computational resources for simulating the formation of galaxies etc. constituted 3/4 of overall electricity consumption at MPIA. It must be emphasized that in many areas of physics numerical simulations etc. are driving insights where analytical methods fail, no doubt. Hence, I‘d like to reiterate Jan‘s disclaimer: “I am not against supercomputing, but we need to plan ahead to be able to adequately compute in the future“ (slide 20). And that starts with being aware of these numbers.
Time for Timescales
In that spirit, let‘s finish off our sample calculation. We‘ll use the reduced numbers9 of 4t for flying (instead of 8t) and 5t for electricity (instead of 8.8t), giving us an annual total of 4t + 5t + 3t + 0.9t + 0.2t + 0.2t + 0.1t = 13.4t per researcher at MPIA in 2019 (see Figure 3). Please note that this number also does not include a physicist‘s private emissions. Now, recall the personal lifetime budget we calculated in the beginning: 30 tonnes. At the pre-pandemic rate of consumption, this budget would be used up in:
30t / 13.4t per year ~ 2 years10
Two years. Please pause and think: Do you truly believe governments, big companies etc. will implement systematic change on that time scale? Yes, Biden did just pass the Inflation Reduction Act, mobilizing $370 billion to invest in energy security and climate change. Yes, the EU is becoming more ambitious in its Emissions Trading System (EU ETS), e.g. by extending its scope to include fuels used in road transport and buildings. Yes, the electric vehicle (EV) revolution is becoming a cornerstone of the Chinese economy—hopefully with a push for sustainably produced batteries—and yes, climate change litigation is on the rise in countries across the globe. We are definitely starting to see the action of the necessary breadth and depth.
But will that action see effects fast enough? With a probability that doesn’t leave you feeling uneasy? Clearly, an academic lifestyle is above average in terms of CO2-intensity. I believe we should be engaging from our end, too, actively work towards staying within our carbon budget and not relying solely on large-scale actors to solve the problem.
My Plea for Physicists
Hence, I suggest the following. As a baseline measure, our physics community should become more vocal about the orders of magnitude of climate change. For example, you can walk people in your family through a carbon budget calculation like the one above. Or start a conversation by asking a Fermi-style question on climate change. Or you can add an estimate of the carbon cost of your computational simulations into your next paper and presentation. (See the Scientific Conduct Initiative for inspiration!). And most of all, let us put collective pressure on our respective governments.11 When physicists talk orders of magnitude, we tend to get taken seriously.
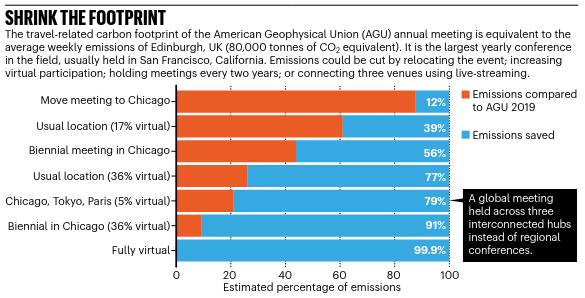
Yet I don‘t feel this is enough, given the consequences other communities e.g. coastal regions will face if we cross temperature tipping points. In addition to the baseline, I think we should actively reshape our culture in (physics) academia to make sure we stay within a fair share of the remaining global carbon budget. There are many good starting points out there. The hub model for conferences, to name just one. (Take a taste in this funky 2-min video). The idea is to split global conferences held at a single location into regional hubs where people can gather in person. This would combine the undeniable pleasures of in-person exchange and collaboration while cutting travel emissions by almost 80%, as calculated in a recent Nature paper 15, see Figure 6. And at the same time, such approaches could open doors for scientists in the Global South or from poor communities who cannot afford to travel long-distance or face visa difficulties.
Overall, I hope the back-of-the-envelope calculations shocked you, just like they shocked me the first time I worked them out. But I also hope there is another sentiment mixed in, a certain satisfaction: the feeling of getting a better grip on, a sense of orientation in the often abstractly loose debate around global warming. I invite you to work through the numbers for your institute, as well. And then reach out, so we can build a better quantitative picture of our status quo.
Equipped with a sense of the scale of how this complex global issue applies to our community, I hope you will be open to discussing and then implementing “academic adaptation“ measures. The regional hub model was one and there are many more waiting for you to explore—go ahead and listen to recordings from the Sustainable High Energy Physics Workshop, for example. I hope we can cross a critical point where localized pockets of awareness and action within our community become the majority and we can turn academia (not just physics), into an authentic voice that does not just talk about climate change but walks the talk, too.
For my fellow physicists: At the end of the day, it will increase the probability of us being able to do the physics we love in the long term. So next time we sit down for dinner, dear J. please at least have an opinion! 😛
About the Author
Anna Knörr is currently a graduate student at Perimeter Institute for Theoretical Physics in Canada. With her family based in central Europe, she is weighing up the orders of magnitude of being an international student. When not being serious, she is usually in a handstand, dancing or trying 100% dark chocolate.
Footnotes
- The poster, including post-it comments received at the Strings conference, can be found here.
- To get some intuition for the unit of measurement “ton of CO2“, see this article here.
- For the physics linking CO2 levels to a rise in temperature, see here.
- Why are we comparing emissions and temperature to the period 1850-1900? Because that‘s when we started seeing an exponential rise in CO2 concentration levels. James Watt’s invention of the steam engine in 1769 kickstarted the Industrial Revolution, leading to a stark increase in first Britain‘s and then the global coal production. Other fossil fuels followed. For more history, read the intro of Sustainable Energy – without the hot air by David MacKay.
- Tons of CO2 vs. CO2eq? The latter also takes gases such as methane into account which contribute to global warming, as well. Indeed, the units used in the MPIA (CO2eq) and IPCC (CO2) reports are not the same in this regard. But I suspect this does not impact the orders of magnitude we will calculate. Hence, please excuse me for mixing these units in the following.
- In the air travel analysis, we were supported by the advanced ETH Air Travel monitoring program. Furthermore, the woman to credit with building up this program, i.e. the wonderful Susann Görlinger, has now transferred to ifeu Institute in Heidelberg, Germany, where she is now coordinating the FlyingLess project. Check it out and bring it to your institute so we can base our discussion on solid numbers!
- Out of interest, I emailed Jan to ask what made this difference and he pointed me towards a difference in methodology: The first time round, the MPIA team used atmosfair to calculate the emissions, while the second time round he coded up a little tool himself. The reason for the change was the high radiative forcing factor used by atmosfair (3 instead of 2, as commonly used by other available emission-calculators). On the practical level, using atmosfair also meant having to type in each flight separately, while the Github tool can simply read a long list in one go.
- Turns out the MPIA number of 5t is actually an underestimate: MPIA purchases its electricity from public utilities Munich, Heidelberg and Stuttgart which have a below-average carbon intensity factor. Using the German average, MPIA‘s electricity contribution would actually be valued at 25MWh * 0.35 t/MWh ~ 8.8t.
- Jan also pointed out to me that their report did not include contributions from infrastructure (e.g. constructing the institute building, telescopes, satellites etc.). The latest reports suggest this might well be the single largest contribution to the carbon footprint of an astronomer!
- An exercise for the reader: What timescale do you get for achieving the 1.5° goal with a probability of 50%? What about the 2.0° goal? Going through that calculation should help avoid feeling doomed. Even more, it should help you get a sense of scale and lay a basis for informed discussion!
- For example, if Germany got its carbon intensity factor down to the standard in Norway, an MPIA researcher ‘s supercomputing contribution would fall to 20 MWh * 0.034t/MWh ~ 0.68 t of CO2eq. That‘s because 99% of Norway‘s electricity comes from hydropower!